Our approach to delivering seismic hazard projects
1 PSHA Background
The widely adopted methodology for assessment of seismic hazards is Probabilistic Seismic Hazard Assessment (PSHA). It took precedence over the deterministic methods which were used prior to the emerge of the PSHA theory in the 1960s. Key advantage of PSHA is that it explicitly allows for incorporation of the randomness associated with future earthquakes, in terms of magnitude, frequency and location. The inherent randomness in earthquake occurrence and ground-motion generation is often referred to as ‘aleatory variability’, which is characterized by probability distributions that are directly integrated in the hazard calculations.
There are two basic models required to conduct a PSHA, seismic source characterization (SSC) model and a ground motion (GM) prediction model. The former defines the location of sources where future earthquakes could occur, which are generally either broad areas or individual fault lineaments identified as potentially active. In addition to the location of earthquake scenarios, the SSC model also specifies the occurrence rate of earthquakes of different magnitude and the largest earthquake that each source is considered capable of generating. The GM model will usually consist of equations (known as GMPEs) that predict values of the physical parameters that are generated by an earthquake – spectral accelerations at a range of response frequencies, plus the peak ground acceleration (PGA) as a function of earthquake magnitude, source-to-site distance, and the site classification in terms of soil/foundation stability, as well as other parameters such as the style-of-faulting. Rather than yielding unique deterministic estimates of the ground-motion for a given magnitude-distance scenario, the GMPEs predict a probabilistic distribution characterized by a logarithmic standard deviation. In contrast to the deterministic approach where single magnitude-distance scenario defines the predicted ground motion, PSHA considers all possible combinations of events with plausible magnitudes for the region according to the limiting conditions specified in the SSCs model (in 50 yrs there could be 100 M 3 events, 10 M 4 and 1 M 5 for instance) and calculates the annual frequency of exceeding different levels of shaking at the site of interest.
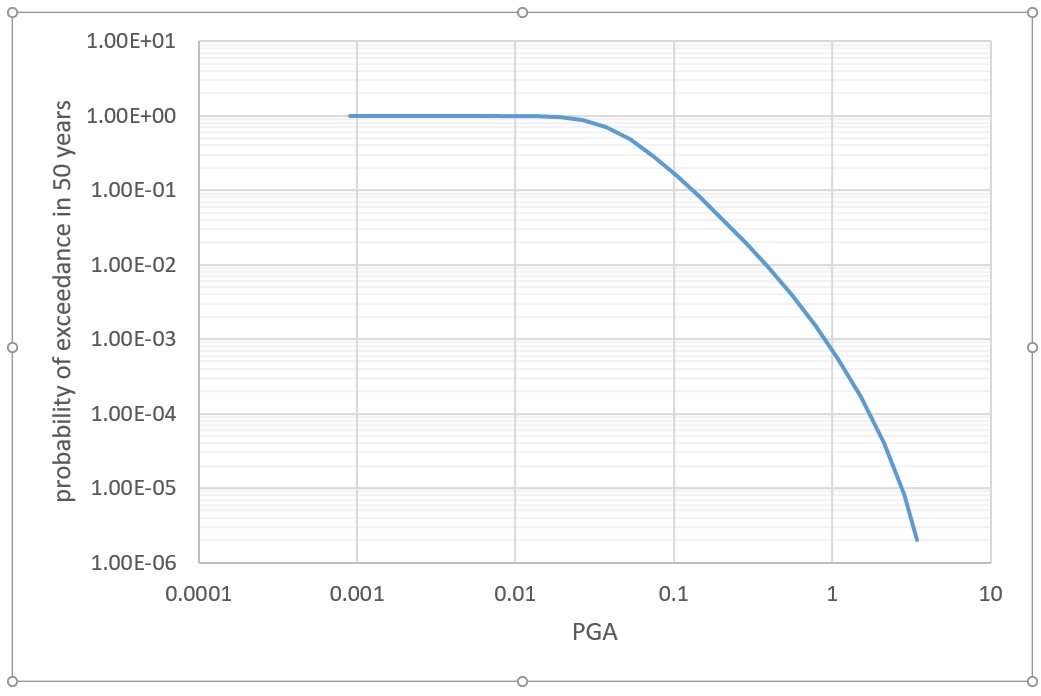
The outcome is a seismic hazard curve, showing, for example, PGA against annual frequency of exceedance or its reciprocal, the return period indicating the interval of time in which given ground motion levels could be expected to be exceeded at a given site.
Characterization of the sources of future earthquakes is not very exact and will always be subject of much discussion because of the generally limited knowledge that we have with regards to the source dynamics. Expert judgment between the involved stakeholders is needed in the interpretation of the data to formulate seismic source models.
There is uncertainty associated with the theoretical models build to define potent seismic sources in terms of location, depth, geometry and dynamics.This uncertainty reflects the lack of knowledge about the actual characteristics and it is widely refereed to as "epistemic uncertainty".
The tool most commonly used to capture epistemic uncertainty in PSHA is logic tree, in which alternative models or parameter values are placed on different branches and assigned weights reflecting the relative merit of their actual realization.
Probability distribution instead of discrete value is needed to define the possible depth of the next earthquake occurrence even for well known structures. Events may have been triggered 5km beneath the surface in the past, but the same structure may well produce the next one at different depth level, which would change the resulting seismic effect.
The result of the PSHA is a seismic hazard curve which is calculated for each separate branch of the logic-tree. The resulting curve is a sum of the product of the individual branches weighted accordingly. Epistemic uncertainty therefore, leads to a number of weighted hazard curves forming a statistical population defining the mean hazard as well as it's fractiles. Sometimes, for high profile projects, the number of branches in the logic tree could go wild and difficult to handle. One such case is the PEGASUS project in Switzerland (2000 - 2014) related with the seismic safety of all Swiss NPPs. All the top brains in the profession were recruited in this project where the logic tree branches got to 10 to the power of 27!
PSHA determines conditions for defining seismic design loads tied with the required assurance of safety of the installation. It is up to project owners as well to define appropriate earthquake prediction metrics that will reflect target operational/safety levels and investment defense considerations.
2 Geological, Geophysical and Geotechnical Database
Geological geophysical and geotechnical investigations and analyses are performed to develop an up-to date, site-specific, earth science database that supports site characterization and a PSHA.
For large scale projects the requirements to the amount of information could potentially involve differentiation into several spatial scales. The International Atomic Energy Agency for instance provides recommendation for nuclear sites requiring presentation of regional (320 km radius around the site), near regional (25 km radius), site vicinity (5 km radius) and site area (1 x 1 km) investigations. Each database incorporating progressively more detailed investigations, data and information.
All data is stored in a uniform reference frame to facilitate comparison and shall be integrated into Geographic Information System for the project.
The purpose of obtaining data on geosciences at regional scale is to provide knowledge of the general geodynamic setting of the region and the current tectonic regime, as well as to identify and characterize those geological features that may influence or relate to the seismic hazard at the site.
Nuclear projects normally require performance of new investigations such as seismic reflection or refraction surveys, microgravity investigations and borehole geophysics for the vicinity around the site and the site itself in order to demonstrate that there are no capable faults that could pose threat to the installation i.e. geological faults that could cause surface or near surface deformation capable to interfere with the foundations of the main structures at the plant.
For conventional projects however, the compilation of the necessary database involves mostly desktop work for gathering the available data and its incorporation into GIS environment.
The database is used for substantiation of the seismotectonic and seismic source models applied in the PSHA.
3 Seismological Database
A project seismological catalogue should be developed including all historical and instrumentally recorded earthquakes in the region of interest.
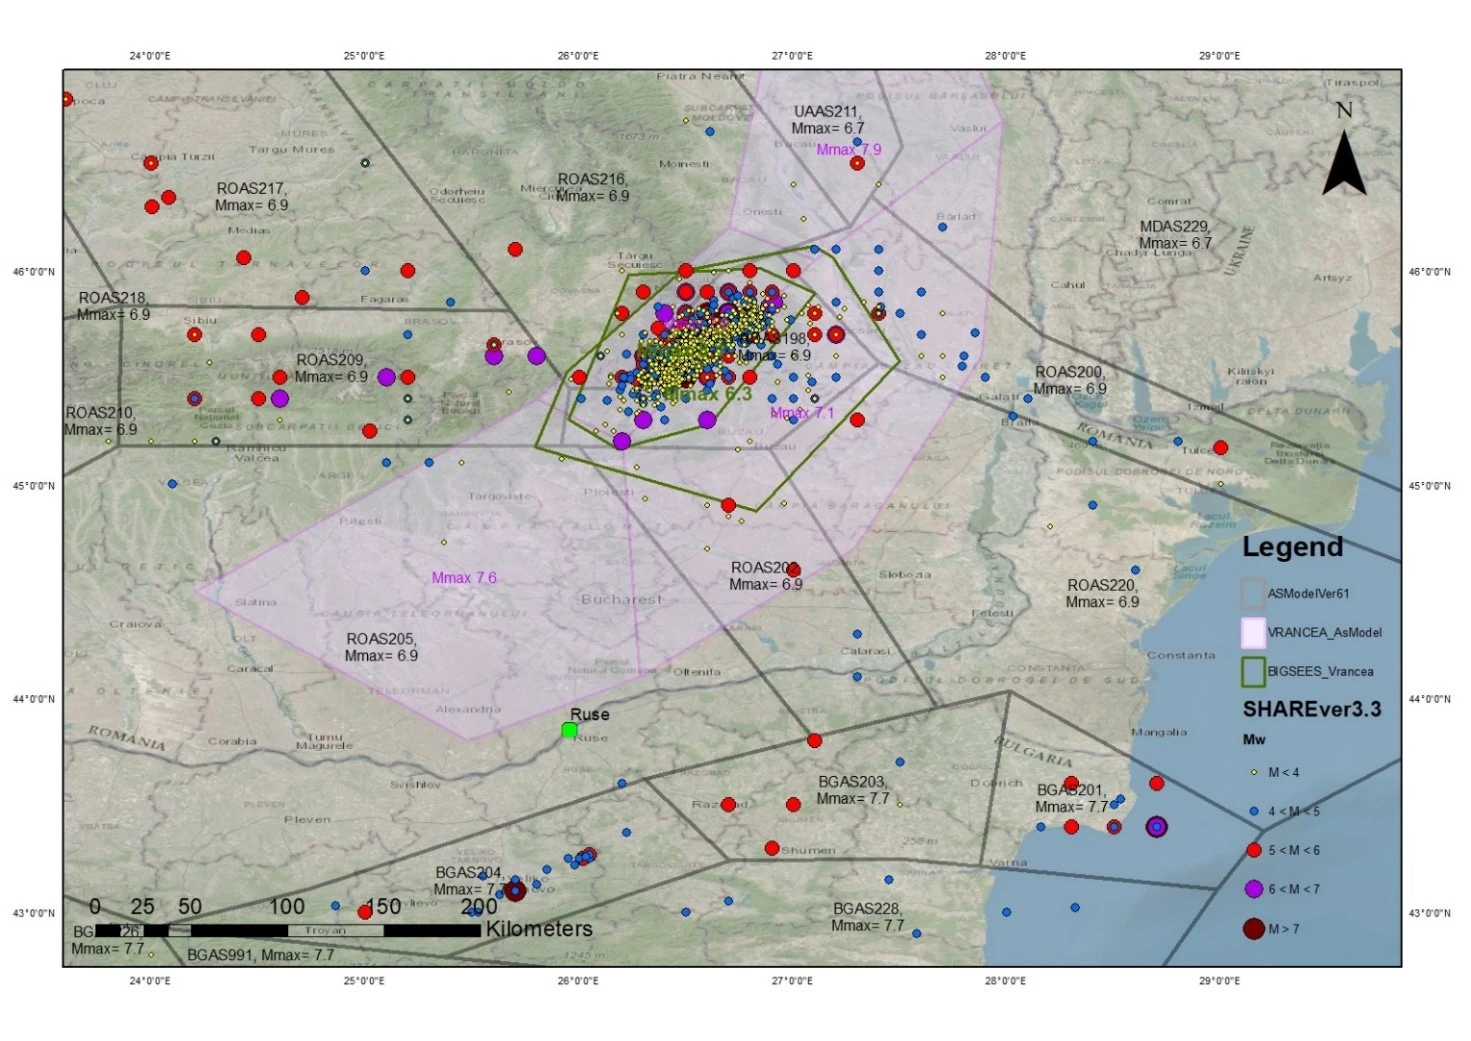
The seismological catalogue(s) shall be integrated in GIS so that seismicity maps could be visualized indicating the level and pattern of seismicity in the area. These maps are often used to substantiate the seismological parameters defined in the seismic source models in the PSHA. By superimposing the outlines of the seismic sources onto a seismicity distribution map, any reviewer could check potential conflicts in the estimates of the maximal magnitudes of a source or its areal dimensions with the actual seismological observation.
The seismological catalogue is key for the evaluation of the completeness intervals in the project catalogue. The completeness analysis is a method for the analytical determination of time intervals in which a particular magnitude class is likely to be completely reported in the catalogue and thus define principles for future occurrence. This is required as the events of small magnitudes M4 and M4.5 are not likely to be observed by the human beings in the pre-instrumental period of seismological observations (prior to 1900) and in historical times, as these are normally only “felt” by instruments not available at this moment especially if epicenters occurred at remote areas.
Presently we have a relatively long time span of observations to form meaningful statistics and come to conclusions for many areas like political reigns for instance or meteorological patterns. In geological terms however, 1 000 – 2 000 years is just a fortnight. We surely miss important earthquakes occurred in the last 10 000 years not known because the civilization did not have the means and ability to archive such events or because archives are not discovered and thus not available.
On the basis of the completeness intervals, magnitude-frequency distributions are developed defining the earthquake recurrence rates for each source in the PSHA.
4 Seismic Source Characterization Model
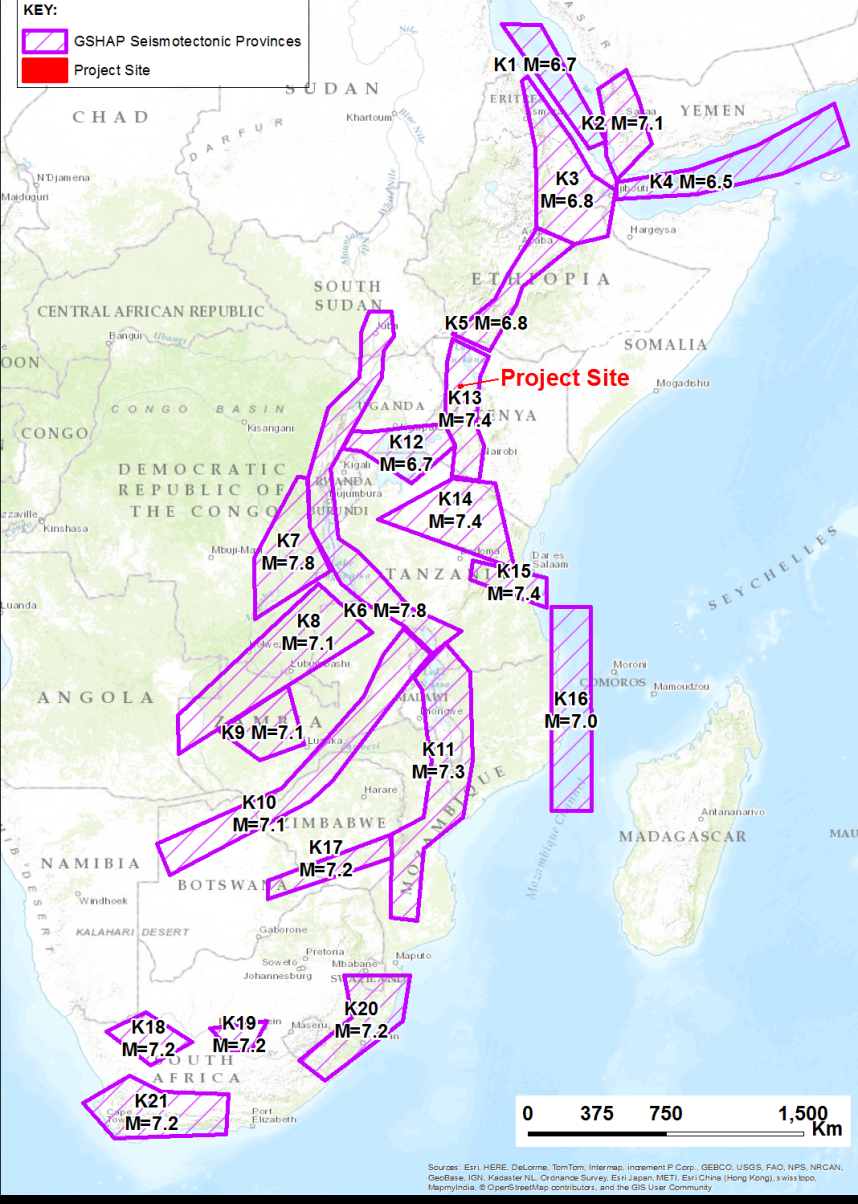
The seismotectonic modelling links the geological, geophysical, geotechnical and seismological databases for a region of interest, in order to define seismic sources for use in Seismic Hazard Analysis (SHA).
The identified seismogenic structures may not explain all the observed earthquake activity. This is because seismogenic structures may exist without recognized surface or subsurface manifestations, and because of the timescales involved; for example, fault ruptures may have long recurrence intervals with respect to seismological observation periods. Consequently, any seismotectonic model should consist, to a greater or lesser extent, of three main types of seismic sources:
- areal sources
- fault sources
- point sources
Areal sources are used to model the spatial distribution of seismicity in regions with unknown fault locations.
Fault sources are used to define the known faults in the area of interest. They were initially modeled as multi-linear line sources. Now they are more commonly modeled as multi-planar features. The earthquake ruptures are distributed over the fault plane. Usually, the rupture is uniformly distributed along the fault strike, but may have a non-uniform distribution as well.
Point sources are used for modelling distributed seismicity. In fact, any background seismicity or areal source represents a 3D container with given geometric shape, which is filled by uniformly distributed point sources in a grid based on the magnitude-frequency distribution defined for the areal source.
Any seismotectonic model ideally, shall incorporate all possible sources capable to generate ground motion above certain level at the site(s) of interest taking into account the current tectonic regime in the region.
When it is possible to construct alternative seismotectonic models that can explain the observed geological, geophysical and seismological data and the differences in these models cannot be resolved by means of additional investigations within a reasonable time frame, all such models are normally taken into consideration in the final hazard evaluation, with due weight given to each model. The epistemic uncertainty (i.e. the uncertainty associated with the modelling process) should be adequately assessed to capture the centre, body and range of technically defensible interpretations of the informed technical community.
5 Ground Motion Prediction Model
An essential element in both deterministic and probabilistic seismic hazard analyses is the ability to estimate strong ground motion from a specified set of seismological parameters. This estimation is carried out using Ground Motion Prediction Equation (GMPEs).
A GMPE, is a mathematical equation that relates given strong-motion parameter to one or more parameters of the earthquake source, wave propagation path and local site conditions, collectively referred to as seismological parameters.
Tectonic environment refers to the state of stress and the seismological properties of the crust. GMPEs have traditionally been classified into four basic types for estimating strong ground motion:
(1) Shallow crustal earthquakes in a tectonically active region,
(2) Shallow crustal earthquakes in a tectonically stable region,
(3) Intermediate depth earthquakes (also known as Wadati-Benioff or intraslab earthquakes) within the down-going crustal plate of a subduction zone and
(4) Earthquakes along the seismogenic interface of the down-going and overriding crustal plates of a subduction zone.
The shallow crustal environment can be further subdivided into compressional and extensional regimes.
Candidate ground motion models for a logic tree should be selected in order to obtain the smallest possible suite of equations that can capture the expected range of possible ground motions in the region (at the site) of interest. This is achieved by starting from a comprehensive list of available equations and then applying criteria for rejecting those considered inappropriate in terms of quality, derivation or applicability.
There is currently a significant number of GMPEs available in the literature (possibly more than 1 000 as of 2020) and their number is continuously increasing with the constantly evolving strong motion datasets.
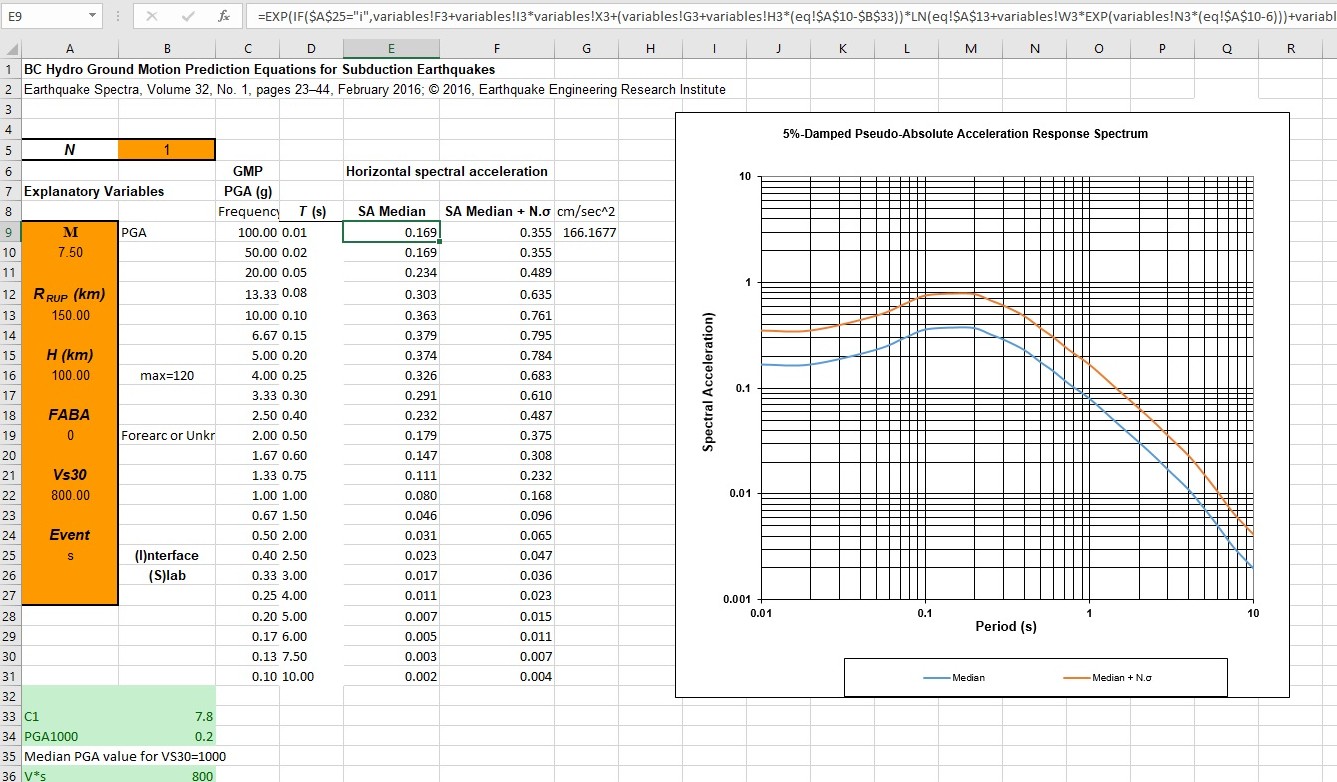
In order to select the right set of GMPEs for a project, there are a number of rejection criteria applied in the engineering practice. In order to get a good grip on each potential model we in ADC Ltd. apply simple but very effective technique. Once there is a manageable set of models, these are all programmed in MATLAB or Excel so that we can start testing their behavior and check the stability of their predictions for the exact seismogenic paths and site classification peculiarities of the project at hand.
In addition, to get to the final suite of project specific GMPEs we test their predictions against real earthquakes with published ground motions available in the literature in different stations at or near the region of interest.
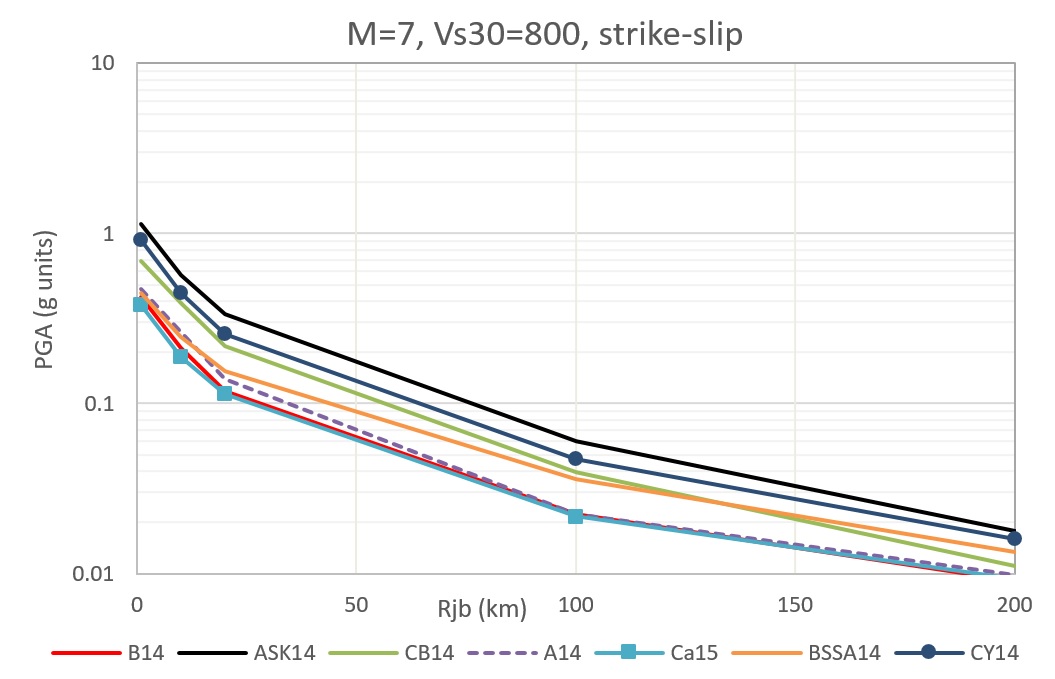
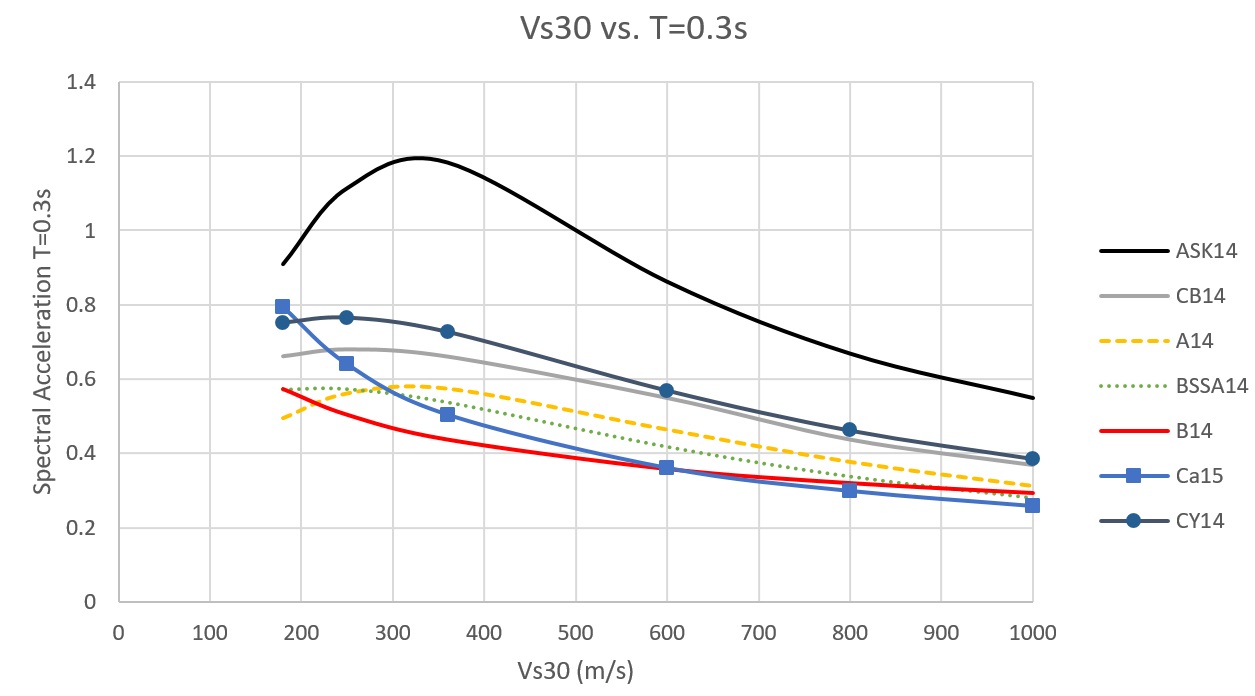
In the selection process, a number of attenuation plots are prepared in order to compare the behavior of the predictive models.
The comparison is important in the selection process as it provides numerical basis for selection. Good selection indicators would be charts of: attenuation with distance, magnitude scaling, style of faulting, Vs30 scaling, predicted response spectra, aleatory variability etc.
Justification is needed for the exclusion of some of the candidate models which were part of the testing. Finally, the project specific GM models shall be assigned appropriate weights for application in a logic tree for PSHA.
Discussion on the selection with respect to previous studies in the area or current studies for neighboring regions could be useful.
6 Software
ADC Ltd. performs PSHA calculations using the state of the art OpenQuake engine. This is an open source engine for seismic hazard and risk assessment developed by GEM foundation, with an idea to provide the technical community with open and transparent tools for evaluation of seismic hazard & risk, thus ensuring better public understanding and acceptance of the results from such studies, which often have great visibility on national and international levels.
The purpose behind the foundation of OpenQuake is to provide robust, transparent, reliable, and extensible software, serving and reflecting the needs of a wide spectrum of users. The development of open-source software in this framework is therefore a prerequisite, which allows seismic-hazard and risk practitioners to scrutinize and contribute to the methodologies/algorithms adopted for the calculations. The fundamental motivations that inspired the creation of the OpenQuake Engine, the hazard and risk software are those of reproducibility, testing, and community-based development process.
The core of the OQ-engine is developed in the programming language Python. For an open-source scientific project, Python has many advantages because it is released with an open-source license and has an extensive set of scientific and numerical libraries that make it an attractive environment for interactive development between scientists and IT developers.
7 Presentation of the Results
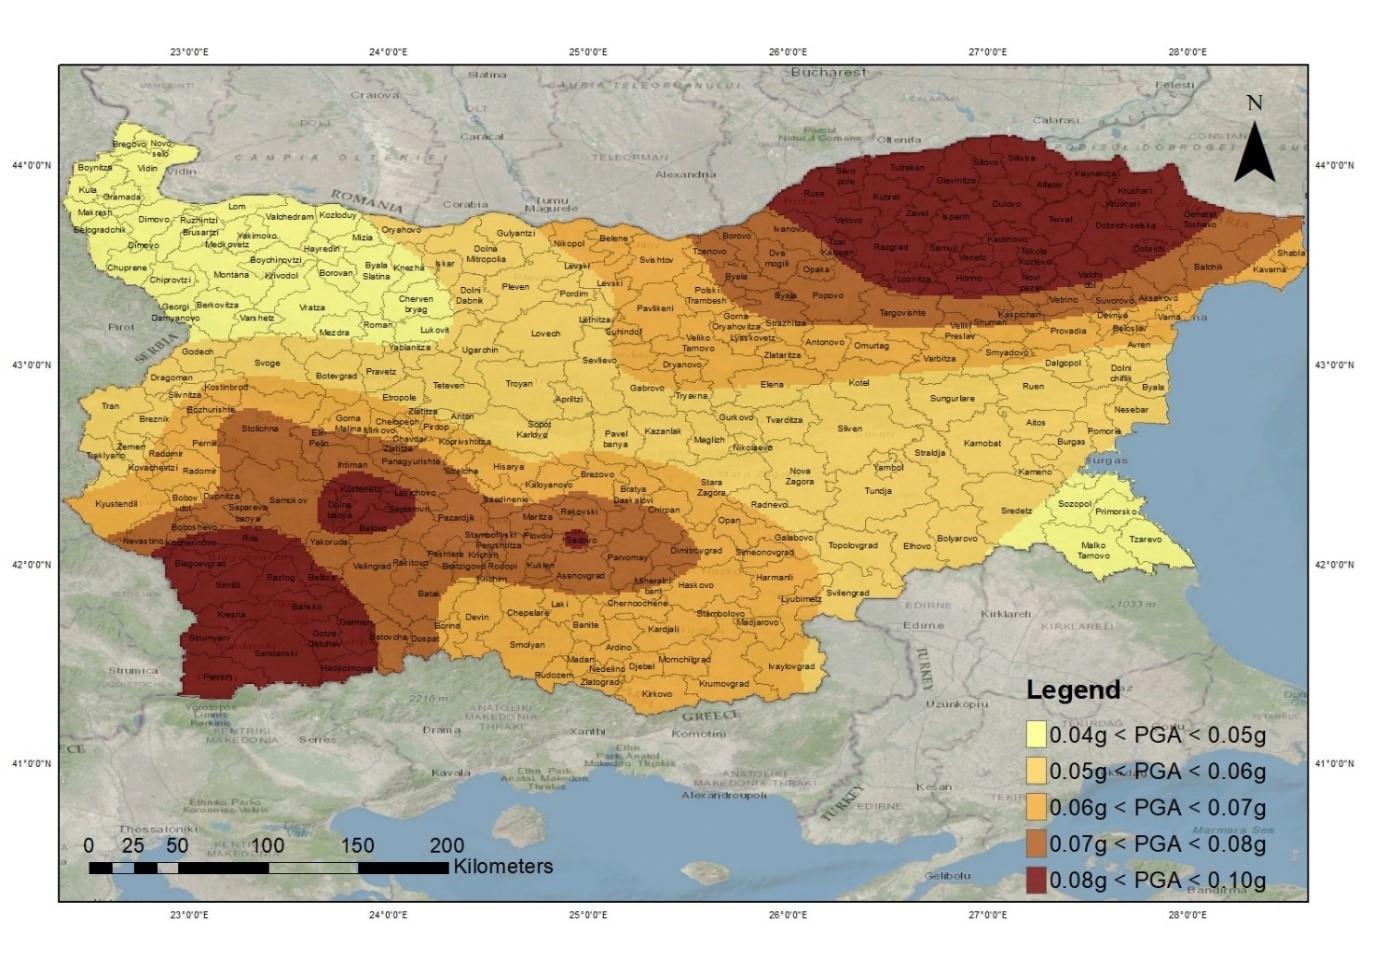
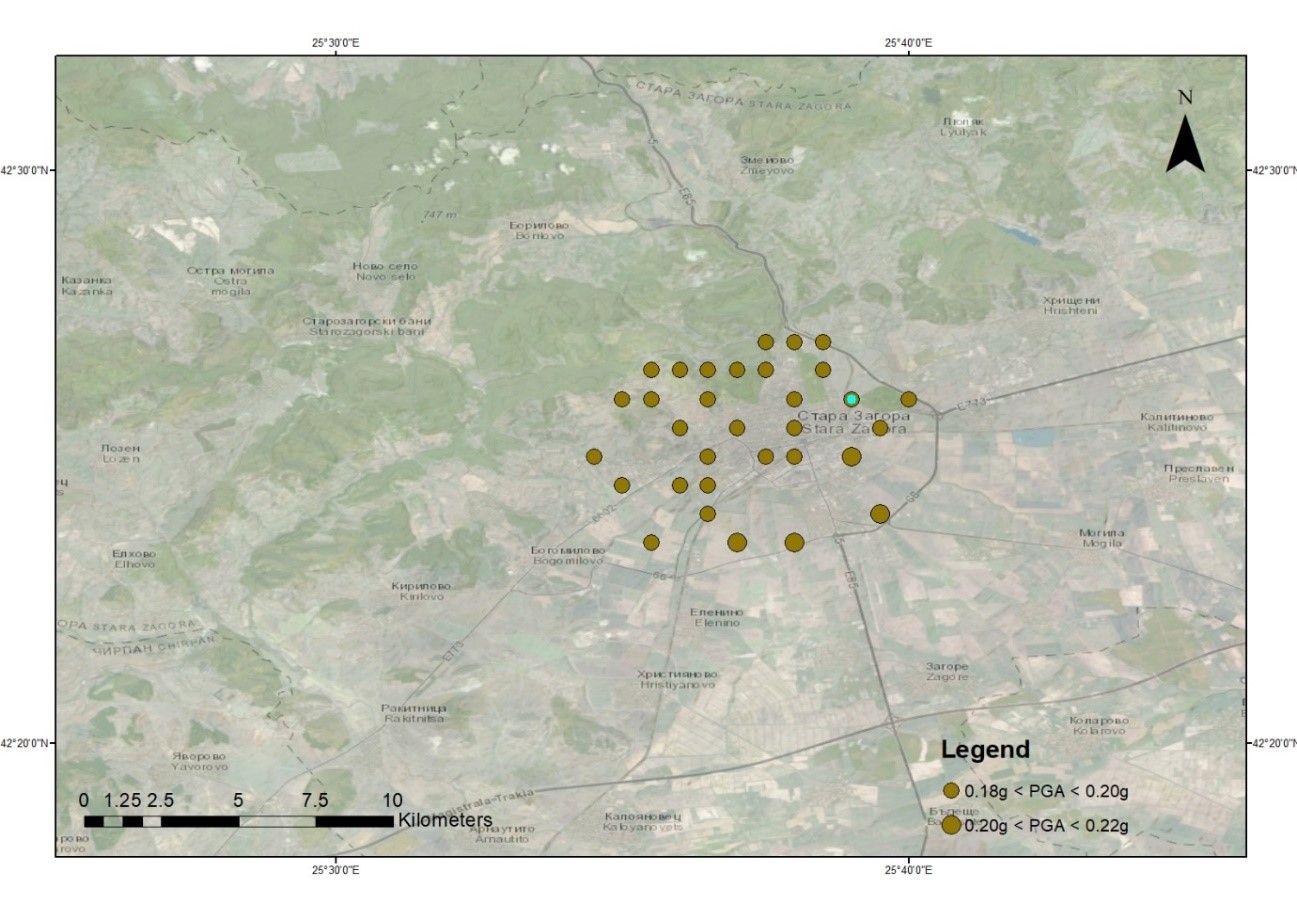
The results of a multi-site PSHA project could be presented in terms of PSHA maps for given structural period and exceedance probability.
Seismic Hazard Curves
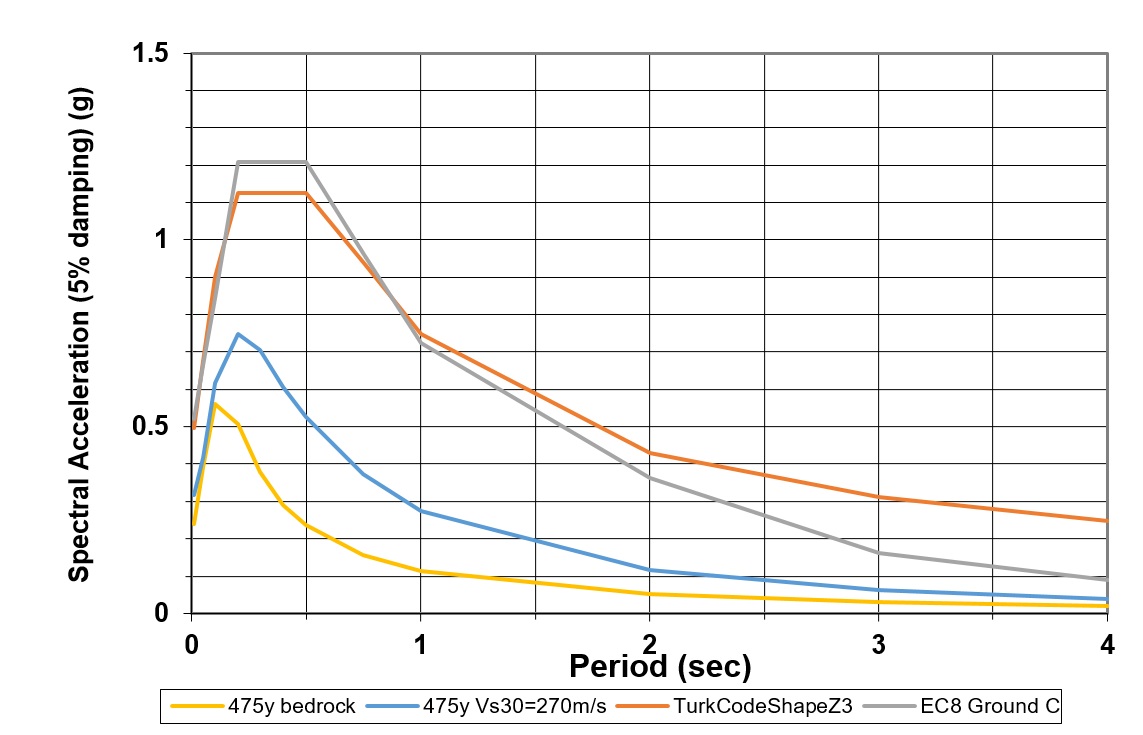
And Uniform Hazard Spectrum and or design EC8 standard shape spectrum
8 Deaggregation of the PSHA
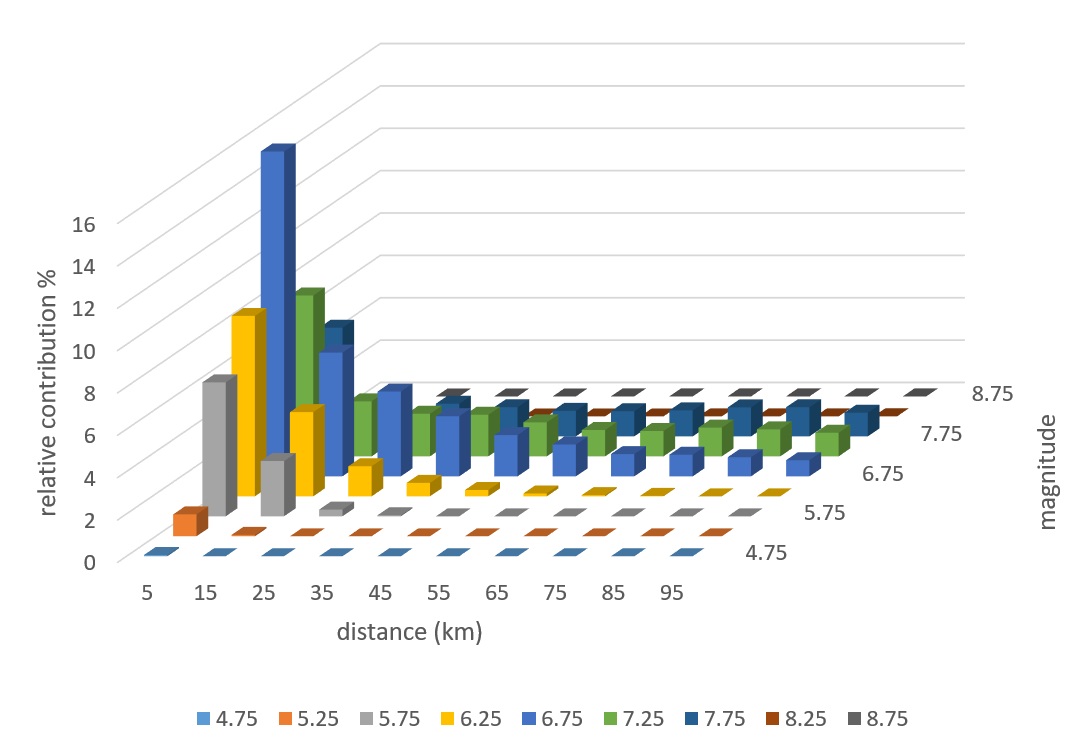
Deaggregation of the PSHA is very interesting and informative tool. It examines the spatial and magnitude dependence of the PSHA results. The aim is to determine the magnitudes and distances that contribute the most to the calculated probabilities of exceedance at a given return period and at a structural period of engineering interest.
The hazard is partitioned into selected bins specifying sub-intervals for which the deaggregation is performed. The relative contribution to the total hazard of each bin is calculated by dividing the bin probability of exceedance by the total probability of exceedance of all bins. The results are displayed as a histogram giving the percent contribution to the calculated ground motion levels as a function of selected hazard parameters.
The following type deaggregation histograms could be presented:
- Magnitude deaggregation;
- Distance deaggregation;
- Magnitude-Distance deaggregation;
- Latitude-Longitude deaggregation;
- Magnitude-Distance-Epsilon deaggregation;
- Latitude-Longitude-Magnitude deaggregation
- Tectonic Region Type deaggregation
The modes of the distribution (bins with the largest contributions) identify those earthquakes that contribute the most to the total hazard.